Mission Statement

"Our mission is to create peace of mind and build enduring relationships."

Bob Lancaster Insurance's mission statement is the core of our culture. Our customers always come first, and we strive to provide them with the products and service that best respond to their needs. Building trust and fostering loyal, long-lasting relationships are the essence of who we are and fundamental parts of our company values.

Putting our mission statement to work

Our employees work hard to connect with our customers on a very real and personal level. Find out what Bob Lancaster’s mission means to them and how they carry it out every day.

Bob Lancaster Insurance, serving Florida's insurance needs since 1964. Contact us today at 321-725-1620 - see what we can do for YOU and YOUR BUSINESS!

Monday, January 27, 2014

Bob's Business Tip: Improve Your Verbal Business Card

What do YOU do?

Your best opportunities for making connections with a new contact lie in letting the other person do more of the talking.
clip_image004

Your Verbal Business Card: Do you have one prepared for?

1. The Elevator Speech
2. The 30-Second Commercial
3. “What do you do?”
4. The 3 or 5 Minute Presentation

The Elevator Speech

“What Do You Do?”
Introduce your business without coming on too strong.
Introduce yourself in a way that people will want to ask you for more information.
Keep it short!!!


clip_image008

Use POWER VERBS

• Think of verbs like teach, create, design, reorganize, manage, develop, establish, boost, generate. Use one of these verbs to describe what you do. It makes you more of an innovator and an expert in your profession.

clip_image010
NUMBERS HOOK
Numbers hook attention.
• People love numbers…numbers sound like statistics, and statistics are real.
• Numbers carry remarkable credibility that descriptive words don’t.
• Numbers can generate a little anxiety.
• We judge ourselves by numbers all our lives. Age, weight, income — we’re all either on the right or the wrong side of 30.
• Numbers create urgency, and urgency prompts action.

Write your NUMBERS HOOK

• What kind of results do you produce.
• How many? In how much time? How often?
• These percentages are extremely useful to drop into the conversation.
• They make your results that much more believable.
For example, “I’ve developed five ways  to _____  within ___ months.”

SOLVE A DEEP NEED

• This is the most important part of the 30-second message.
• This is where you speak of the value you offer your clients.
• Tie that value to the deepest needs people have — more money, better relationships, or better health.
• Tell me your greatest success stories!

clip_image012

What is unique about YOU?

• What is your Unique Selling Proposition (USP)?
• Things you do well… better than anyone else.
When And How To Use A Memory Hook
The best memory hook is one that you can use in many contexts.
• It should work in a pure word-of-mouth setting, as when you are attending a meeting of a networking group.
• It should work on your business card, on your letterhead, your calendars, your giveaway pens (another reason to keep it short), even your print ads.
• Of course, networking opportunities are one of the most cost-effective forms of advertising.
• The problem is, that most people don’t know how to stand out in the crowd at these of events.
• memory hooks have a distinct edge over their competition..

Example: For a Pest Control Business
• Bugs…They can run but they ONLY Die Tired


clip_image014

Prepare, Practice, & Master

• It is critical to prepare PRACTICE and master a ‘verbal business card’ to create interest with your response.
• Remember, you have only 10-30 seconds to grab their attention
The 30-Second Commercial
Once someone has indicated some interest, give them a brief description of what you do and peak interest even more.

clip_image016

Anatomy of a 30 second presentation

Give examples of ways you have helped others- how and why it was valuable to them. Be as specific as possible
Answer the following:
  • Who are you looking for?
  • What kinds of referrals?- Be specific
  • What can you do for them?
  • …can do it in time or cost?
  • When do you do what you do?
  • Any Free services? consult?
  • Why should they come to you? Any outside credibility
  • How many years? of experience –
  • Where do you do what you do?
  • USE a “Did you know?” (gets attention)
People like to learn new things

Practice it, Practice it, Practice it.

Anatomy of a 30 second presentation
1.    Intro My name _______ and I’m with ______
2.    Memory Hook
Good hooks are memorable, descriptive and short.
Be creative.
Use words that paint pictures.
Help people to visualize what a good referral is for you
A good memory hook does not have to be funny but it helps
_______________________________________________
3.    The Body
Ideally, you should deliver a different from time to time.
Focus on one service, discuss the benefits rather than the service
Itself.  Also what is a   good referral for you.
___________________________________________________
4.    The summation.  In one or two short sentences, reiterate what you have just said, stating the reasons to act now!
5.    The Closing.  State one more time your name and the name of your company

                                    Contact us for all your Insurance needs! (321)725-1620

Bob Lancaster Insurance
Serving Florida since 1964

Friday, January 24, 2014

10 States with the WORST DRIVERS (Florida is #6)


Road rage, careless driving, swerving cars: these may all be things you encounter during your normal commute. And the thought “This state has got to have the worst drivers!” may cross your mind from time to time.

It’s time to update our findings with the latest driving statistics and ask once again, “Which state has the worst drivers?“. Keep in mind that not only are bad drivers aggravating and dangerous, but they contribute to increased auto insurance premiums in your State!

Methodology

The rankings are based on statistics pulled from several sources, including the National Highway Traffic Safety Administration, the National Motorists Association, and Mothers Against Drink Driving.
There are five categories for each score, including:
  • Fatalities Rate per 100 Million Vehicle Miles Traveled
  • Failure to Obey (Traffic Signals + Seat Belts)
  • Drunk Driving
  • Tickets
  • Careless Driving
We translated all of this information into one Total Score: the higher the score, the worse off the states were.

For example, the state with the most Careless Driving, Florida, got a 51 on the scale (District of Columbia is included in the rankings). The higher the score in each category, the worse the drivers, and the higher your state’s car insurance rates could be.


Here are the Top 10, in descending order:

Ten States with the Worst Drivers:


#10) North Dakota

Best Ranking Factor: Tickets: 6th
Worst Ranking Factor:
 Drunk Driving: 50th
north-dakota-worst-drivers
Source: commons.wikimedia.org
North Dakota was not in the “Top 10″ in our previous edition, but they’ve dropped three places with the latest statistical updates. They kept their Ticketing Rate low, but increases in the Drunk Driving and Fatality Rate categories leaving them with a lot of room for improvement.

#9) Montana

Best Ranking Factor: Tickets: 2nd
Worst Ranking Factor: 
Fatalities Rate & Drunk Driving: 51st (the worst possible rank)
montana-worst-drivers
Source: en.wikipedia.org
Montana maintained the worst fatality rate per 100 million miles traveled (this year ranked 51 because we included the District of Columbia), and received a worse Drunk Driving score than last time. What saved them from a lower overall score? Their rating of second best when it comes to likelihood of getting a ticket.

#7 ) North Carolina (tie)

Best Ranking Factor: Drunk Driving: 31st
Worst Ranking Factor: 
Careless Driving: 44th
north-carolina-worst-drivers
Source: www.worldpropertychannel.com
North Carolina’s rankings start out just above the average, but receiving Top 10 finishes in both Ticketing Rate and Careless Driving mean they’re five spots higher than their previous position. The biggest jump in their ratings came from the Careless Driving category – 13 spots worse than our last measurement.

#7) Missouri (tie)

Best Ranking Factor: Careless Driving: 25th
Worst Ranking Factor: Failure to Obey: 48th
missouri-worst-drivers
Source: en.wikipedia.org
Missouri has done well to improve from it’s previous #2 finish, relatively speaking. They have the same total score, but other states have gotten relatively worse. Missouri showed significant improvement in the Careless Driving category, but finished too near the bottom for Failure to Obey.

#6) Florida

Best Ranking Factor: Drunk Driving: 18th
Worst Ranking Factor:
 Careless Driving: 51st
Florida-worst-drivers
Source: www.timeanddate.com
Florida has struggled in both the Careless Driving and Ticket Rate, but slight improvements in the Fatality Rate and Failure to Obey categories help improve their overall rank. It’s worth noting that their Drunk Driving rating dropped from 7th to 18th. Remember – lower ratings are better.

#5) Alabama

Best Ranking Factor: Drunk Driving: 26th
Worst Ranking Factor: 
Tickets: 49th
alabama-worst-drivers
Source: www.stateintegrity.org
Alabama just managed to stay out of the Top 5 last year, but a change in Careless Driving ranking from 7th to 36th in the nation really hurt them. They have improved or stayed the same in every other category, except for Ticketing Rate.

#4) Texas

Best Ranking Factor: Failure to Obey: 33rd
Worst Ranking Factor:
 Drunk Driving: 47th
texas-worst drivers
Source: en.wikipedia.org
Texas has improved it’s overall ranking after coming in 3rd last year, but once again, it’s mostly a matter of the other states getting worse. Their Drunk Driving ranking dropped 16 places to 47th overall. Improvements (however slight) were made in the Fatalities Rate, Failure to Obey, and Ticketing Rate categories.

#3) Mississippi

Best Ranking Factor: Drunk Driving: 30th
Worst Ranking Factor:
 Fatalities Rate: 47th
mississippi-worst-drivers
Source: en.wikipedia.org
Mississippi is the biggest surprise in the Top 10, having come in 23rd in our previous edition of this study. Major increases in Failure to Obey (3rd to 44th) and Drunk Driving (10th to 30th) make up the bulk of the difference.

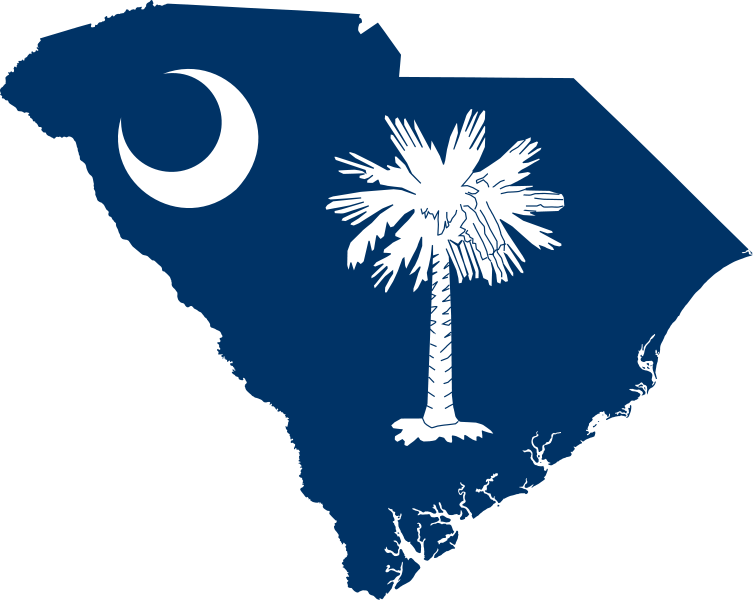
#2) South Carolina

Best Ranking Factor: Failure to Obey: 29th
Worst Ranking Factor: 
Careless Driving: 50th
south-carolina-worst-drivers
Source: Wikimedia
The change in South Carolina’s Careless Driving rating from 3rd best to 50th was enough to bump them from 11th overall to the number 2 spot. Their Drunk Driving rating also was a cause for concern, increasing from 30th to 49th in the US. South Carolina can take some consolation in their improvement in the Failure to Obey category.

#1) Louisiana

Best Ranking Factor: Drunk Driving: 38th
Worst Ranking Factor: 
Careless Driving: 48th
louisiana-worst-states
Source: wikipedia.org
Louisiana drivers once again have the dubious honor of “Worst in the United States”. Finishing in the Top 5 for three different categories (Failure to Obey, Ticketing Rate, and Careless Driving) means they’ve finished #1 for the second time in a row, 5 points higher than South Carolina overall.

A Lower Ticketing Rate Can Mean More Drunk Driving

North Dakota wouldn’t have made the Top 10 without ranking as the second-highest in Drunk Driving.  In fact, 10 of the 15 states LEAST likely to give you a ticket ranked in the top half of offenders for Drunk Driving! You might not want to hear it , but perhaps knowing that they’re more likely to get a ticket helps deter drunk drivers.
Be responsible – don’t drink and drive. It only takes a split second to ruin someone’s life, including your own.

Careless Driving & Fatality Rate are Good Indicators of the Worst Drivers

The best that any of our Top 10 states finished in either of these categories was 25th, with all but Missouri being in the bottom 20 in both categories.
This connection between Careless Driving & Fatality Rate should be even more reason for drivers to put down their cell phones, and keep their eyes on the road.

What do the best drivers have in common? Paying Attention to the Road

Of the 15 states with the best drivers, only 4 ranked in the bottom half for Careless Driving, meaning they were keeping an eye on the road ahead and their surroundings – NOT on their cell phones.
The bottom line: Paying attention makes a big difference, and saves lives. If you want to be a responsible driver, get rid of the distractions and focus on your driving.

Complete Rankings: Worst Drivers


StateFatalities Rate per 100 Million Vehicle Miles TraveledFailure to Obey (Traffic Signals + Seat Belts)Drunk DrivingTicketsCareless DrivingTotal ScoreRank
Louisiana41473846482201
South Carolina49294938502152
Mississippi47443039402003
Texas34334745391984
Alabama40412649361925
Florida33381848511886
Missouri29484141251847
North Carolina31363142441848
Montana5137512331749
North Dakota46315063016310
Oklahoma435020311816211
Nevada24934514316112
Tennessee374021352615913
Georgia28465502915814
Pennsylvania364932182215715
Arizona392112334915416
Arkansas48428153414717
Maryland101433474214618
California112516434514019
Ohio134342281414020
Illinois123039342413921
New York152324403713922
Wisconsin263535232013923
Kentucky44512171913324
Hawaii23248134112725
Colorado204517251312026
Wyoming42203612112027
Delaware27727124611928
Indiana212222371711929
New Mexico38109144711830
South Dakota32284051011531
New Jersey91914293810932
Nebraska18244319210633
West Virginia50161571510334
Michigan171513223510235
Virginia163411301110236
Idaho2539239410037
Kansas3532327310038
Washington7437361610039
Rhode Island884610279940
Alaska451163319641
Massachusetts118442199342
Iowa3013432129143
District of Columbia511044288844
Connecticut46452488745
Maine192629468446
Oregon223716328047
Minnesota217192677148
New Hampshire327251157149
Utah1412120237050
Vermont6528814851